A climate tipping point of 1.5 °C above pre-industrial levels has been discovered. Detailed studies of stalactites and stalagmites in caves in Russia's Lake Baikal region revealed that Siberian permafrost is perilously close to the melting point. A store of carbon twice the size of the atmosphere's will be destabilized if temperatures rise 1.5°C from pre-industrial levels according to a report published on line today in the prestigious Journal Science.
The report's chillingly understated final paragraph reveals that permafrost degradation begins at a temperature of 0.5°C above pre-industrial levels. The climate has already warmed 0.5°C. Massive degradation begins at warming above 1.5°C, which is half a degree below the IPCC's target for warming. The results of this study indicate that the new target must be 1.5 °C if we intend to keep warming from going well above 2°C. 2°C is not a stable target. It is past the permafrost "tipping point" of 1.5°C.
Overall, dated periods of speleothem growth allow an assessment of the relationship between global temperature and permafrost extent. PWP SST was 0.5-1.0°C higher during MIS-5.5 and ~1.5°C higher during early MIS-11 relative to the pre-industrial Late Holocene (Fig. 2D) (20, 21). Using PWP SST as a surrogate for global temperature (20) suggests that increase in global temperatures by 0.5-1.0°C will degrade only non-continuous permafrost in southern Siberia with the Gobi Desert remaining arid. Warming of ~1.5°C (i.e., as in MIS-11) may cause a substantial thaw of continuous permafrost as far north as 60°N, and create wetter conditions in the Gobi Desert. Such warming is therefore expected to dramatically change the environment of continental Asia, and can potentially lead to substantial release of carbon trapped in the permafrost into the atmosphere.
The research team based this profound result on a simple fact. Water flow stops when permafrost freezes solid. Stalagmites and stalactites and other deposits build up in caves when permafrost melts and water flows. Thus stalactites and stalagmites store a detailed climate history in their many layers.
The regional climate record of the last 500,000 years was revealed by detailed mineralogical and geochemical analysis of the cave deposits. PDF Thin layers of precipitate lock uranium and thorium into their crystal structure. The extent of radioactive decay (and build up) in the radioactive decay chain can be measured and modeled to determine the precise age of each layer.
 Supplementary Figure 13: Major speleothems from Gurvan Ze’erd Cave: I – stalagmite-like speleothem MGZ-14; II – the broken top of MGZ-14 that was found nearby and showing petrography more resembling a phreatic overgrowth than stalagmite; cores from speleothems MGZ-8 (III) and MGZ-9 (VI) (calcite mounds on the floor). The latter also don’t show typical stalagmite stratigraphy and the irregular boundaries between layers may also indicate phreatic conditions. The outer layers of all speleothems in this cave are “baked” by burning bat guano that prevented their dating. Locations of the layers where ages (ka) where determined are shown by arrows.
To study regional climate over the past 500,000 years the investigators sampled six caves along a transect from from Eastern Siberia at 60.2°N to the Gobi Desert at 42.5°N.
Very detailed study of the cave deposits combined with cross correlation of cores from Greenland and the deep seafloor revealed that major permafrost degradation occurred when the climate was 1.5 °C warmer than it was in pre-industrial times.
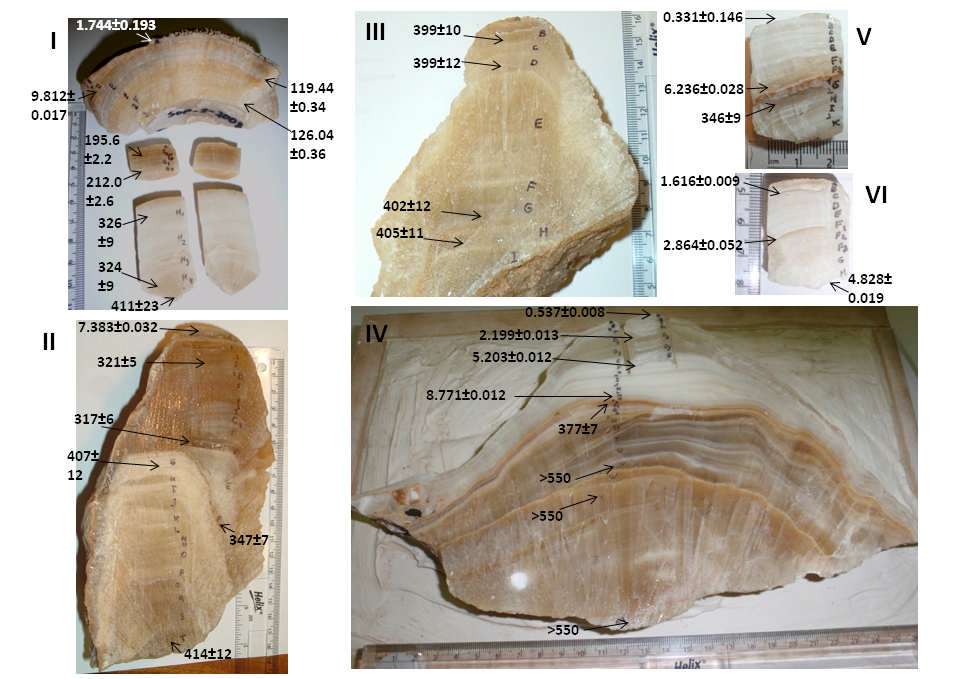 Supplementary Figure 11: Major speleothems from Okhotnichya Cave with their ages in ka: I – stalagmite SOP-2; II – stalagmite SOP-16; III - stalagmite SOP-15; IV – stalagmite SOP-20, cores from tops of stalagmites SOP-18 (V) and SOP-19 (IV).
UPDATE
I directly quoted the last paragraph in the Science report because it contained a key statement about the temperatures at which permafrost melts. Several articles in the media say 1.5°C above present temperatures. The published article says 1.5°C above pre-industrial temperatures. I will provide additional figures that are consistent with what the article actually says.
Caspar Ammann, a paleoclimatologist at the National Center for Atmospheric Research (NCAR) validated the "hockey stick". Note the zero line and the flat long term temperature trend before modern industrial activity injected massive amounts of greenhouse gases into the atmosphere. That's approximately the pre-industrial level.
The Guardian directly interviewed the principal investigator.
The interview confirms the interpretation I have made concerning the tipping point of 1.5°C . Parts of the Guardian article that make claims about melt rates should be ignored because the original article does not provide evidence about rates. Rates are very hard to predict in a rapidly warming climate.
"I would expect to see continuous permafrost start to thaw along the boundaries at this threshold of 1.5C [in future]," said Anton Vaks, of the Earth sciences department at Oxford, who led the research. Temperatures in the region were 0.5-1C higher than in modern times for a period about 120,000 years ago, and at that time stalactites in caves further south, near Lake Baikal, showed signs of growth, and therefore melting.
But for the same period, the stalactites in the far northern cave – called the Ledyanaya Lenskaya cave, near the town of Lensk at latitude 60N – did not grow, showing that the permafrost remained intact at those temperatures. "This indicates that 1.5C appears to be something of a tipping point," said Vaks.
At present, global average temperatures are about 0.6C-0.7C above pre-industrial levels. This means, according to Vaks, that climate modellers should include the possibility of permafrost beginning to melt in their models.
Here's the detailed cave age data 2A cross correlated with Pacific ocean temperature data 2D and other data.
Fig. 2
(A) Distribution of speleothem U-Th ages (±2σ) in time and space (n – total number of U-Th age determinations per cave, including those beyond the U-Th range) with grey bars signifying periods of growth in Okhotnichya and Botovskaya caves. (B) Benthic δ18O stack (30) with MIS numbers. (C) Concentration of biogenic silica in Lake Baikal sediments (%) (23). (D) Pacific Warm Pool Mg/Ca SST, with the pre-industrial Late Holocene SST shown by red horizontal fragmented line (20, 21). (E and F) CH4 and CO2 records of EPICA Dome C respectively (25, 26). (G) Summer insolation at 55°N (28). Speleothems with ages exceeding 500 ka (within ±2σ range) are not shown, but accounted for in n. Two samples SLL9-2-A+B and SOP-32-B are not included because they reflect a mixture of material from different layers; please refer to table S1.


